
Understanding The Difference: Weight Loss vs Fat Loss – Which One To Focus On?
Dr. Gail A. Greendale
Principal Investigator, UCLA School of Medicine
You can tell women that it’s not them. It’s not some character flaw, not a diet flaw, not trying hard enough.
Summary (TL;DR)
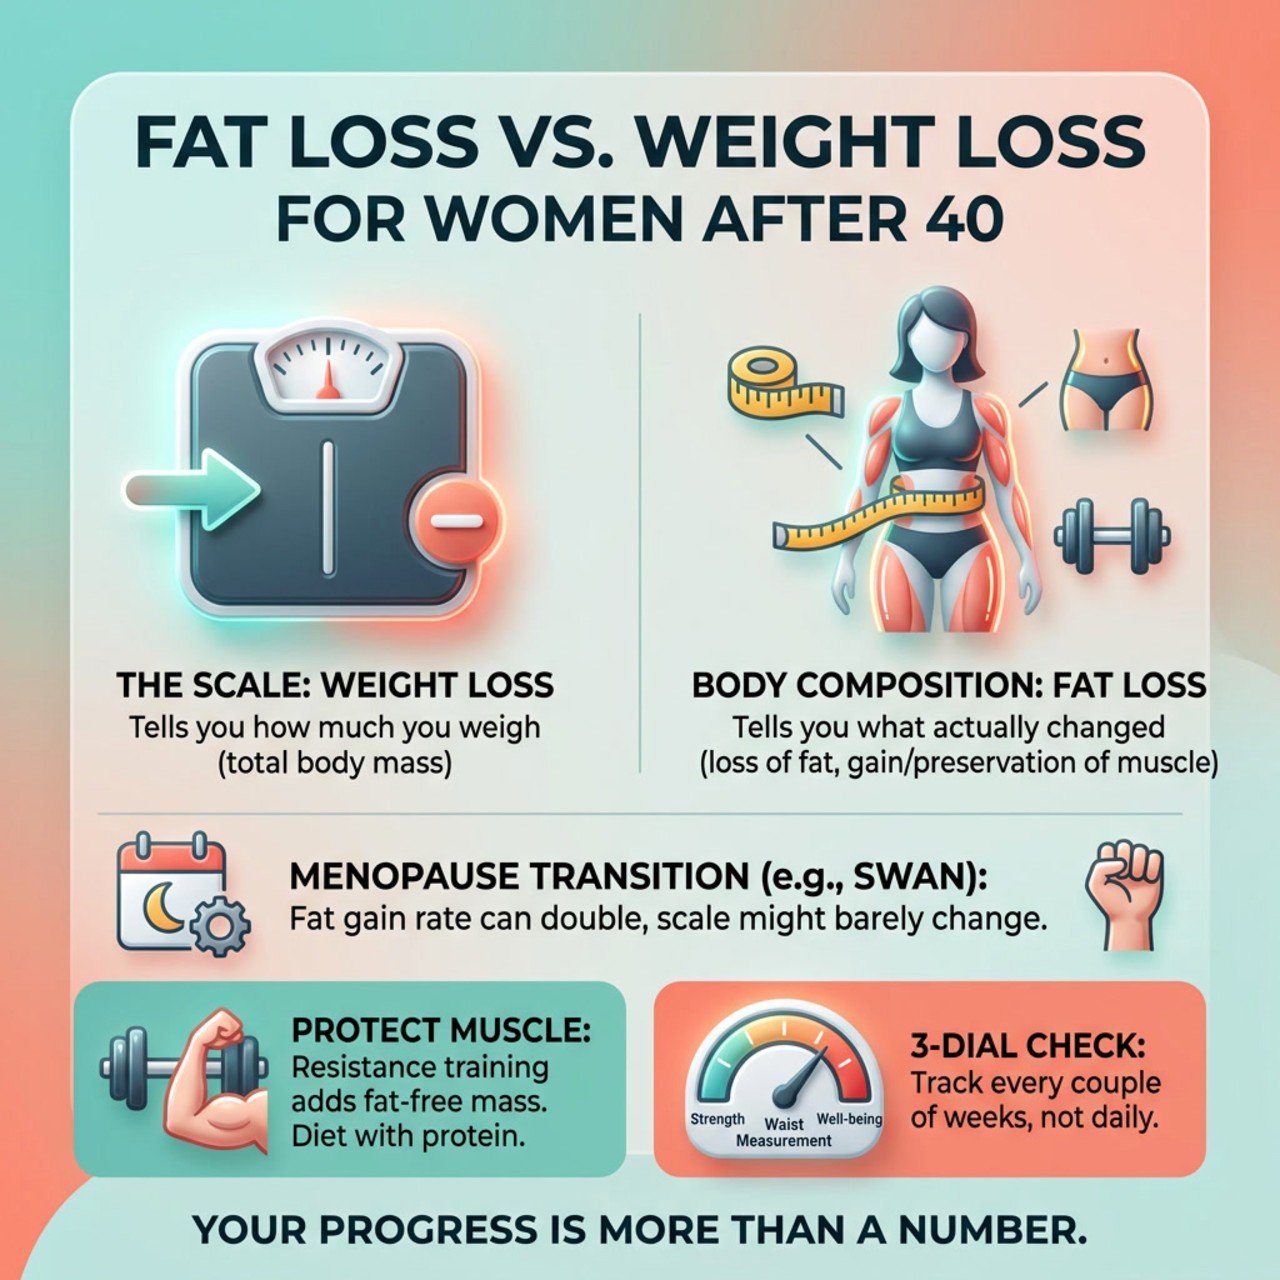
Weight loss is any drop on the scale, whether it comes from fat, water, glycogen, or lean tissue. Fat loss is a drop in body fat specifically, and it’s the one that changes how you look and feel after 40. In a study that followed 1,246 women through the menopause transition, the rate of fat gain doubled, and lean mass declined while scale weight never sped up.
A pooled diet-trial analysis (average age 39) found limb lean tissue made up only 6.7% of women’s weight loss, which is why we think quietly gaining fat is a bigger midlife risk than losing muscle. This guide gives you a simple system, the 3-Dial Check (Scale, Tape, Strength), to know which number to trust when they disagree.
The scale says you’re down two pounds, but your jeans still fight you. Or the reverse: the number hasn’t moved in a month, and your waistband has tightened since spring. If you’re in your forties or fifties, you’ve probably had a week like that, and you probably blamed yourself.
Don’t. The weight loss vs fat loss question isn’t semantics: weight and fat are two different measurements, and the gap between them tends to widen through perimenopause. Here’s where lost weight actually goes, what the research says about muscle and fat at midlife (including where an earlier version of this article got it wrong), and how to tell whether you’re losing fat.
One position up front, so you’re not waiting for it. We think the loudest advice in this space has the risk backwards. Women are told to fear losing muscle, but the evidence we found points the other way: after 40, the quieter risk is fat building up where the scale can’t see it. That’s an editorial position, and we’ll show our evidence so you can judge it yourself.
Medical & Referral Disclaimer
This article is for informational and educational purposes only. It is not a substitute for professional medical advice, diagnosis, or treatment. Always consult your physician or qualified health provider before starting any new diet or exercise program.
Key Takeaways
- Weight loss counts every pound that leaves the scale. Fat loss counts only the fat, and the two don’t always move together.
- When someone loses 10 kg (22 lb) of fat, about 8.4 kg (18.5 lb) leaves as carbon dioxide they breathe out, and the rest leaves as water.
- In the SWAN study, the rate of fat gain doubled, and lean mass declined at the start of the menopause transition, yet weight didn’t accelerate.
- In a pooled diet-trial analysis, arm-and-leg lean tissue made up only 6.7% of women’s weight loss after adjustment, and in a 2026 cohort, only resistance training raised fat-free mass in women.
- Use the 3-Dial Check: read your Scale, Tape, and Strength together, and let the Tape and Strength dials break the tie.

What Is The Difference Between Weight Loss And Fat Loss?
Weight loss vs fat loss comes down to this: weight loss is any decrease in body weight, and fat loss is a decrease in body fat specifically. You can have one without the other, so the scale alone can’t tell you whether your plan is working.
Scale weight is the total of fat, water, stored carbohydrate (glycogen), muscle, bone, organs, and whatever you ate this morning. When the number drops, any of those could be the reason. When it stays the same, fat could be falling while something else rises.
Fat loss is the change you’re actually after. The World Health Organization defines overweight as “a condition of excessive fat deposits” (though it screens with BMI, which we’ll come back to) and lists raised body weight as a risk factor for “cardiovascular diseases, diabetes, cancers, neurological disorders, chronic respiratory diseases, and digestive disorders.”
That’s an association, not a guarantee for any one woman, but it explains why the goal is less fat, not simply a smaller number.
Where Does The Weight Actually Go?
When you lose fat, most of it leaves your body as carbon dioxide through your lungs.
In a BMJ analysis of the chemistry, the authors calculate that when someone loses 10 kg (22 lb) of fat, 8.4 kg (about 18.5 lb) is exhaled as CO2 and the remaining 16%, roughly 1.6 kg (3.5 lb), becomes water. Their conclusion: “The lungs are the primary excretory organ for weight loss.”
So fat doesn’t simply vanish or sweat out. It’s chemically broken down and mostly breathed out. That’s a slow, cumulative process, which is why the daily wobble on your scale is usually something else: water, food, and waste.
| What Changes | What It Is | How It Shows Up On The Scale |
|---|---|---|
| Body Fat | Stored energy (triglyceride) | The change you want. It leaves slowly, mostly as exhaled carbon dioxide. |
| Water And Glycogen | Stored carbohydrate, held with three to four parts water | Moves fast in both directions, so a quick early drop isn’t proof of fat loss. |
| Lean Tissue | Muscle and other non-fat tissue | Some loss is normal on any diet. Training and protein influence how much. |
| Everything Else | Food, fluid, and waste in transit | Why your weight can differ by a few pounds between morning and night. |

Why Water And Glycogen Can Make The Scale Lie
Glycogen, the carbohydrate your body stores for energy, is held with water, so a change in how you eat can move the scale without moving your fat.
A 1992 paper in the American Journal of Clinical Nutrition notes that glycogen is stored in hydrated form, with three to four parts water, and its title warns of the “illusions of easy weight loss.” That’s one reason the first week of a new plan can look better than it is, and why an early dip on the scale isn’t proof of fat loss.
Why The Scale Misleads Women After 40
During the menopause transition, your weight can hold steady while your body swaps lean tissue for fat.
The clearest evidence comes from SWAN, the Study of Women’s Health Across the Nation. In its body-composition analysis of 1,246 women, measured by DEXA (X-ray body-composition) scans, fat and lean mass both rose before the transition.
Then, at the transition’s start, the rate of fat gain doubled and lean mass declined, and those changes continued until about two years after the final menstrual period. Weight, meanwhile, climbed steadily without speeding up.
Read that twice, because it’s the reason this article exists. The scale looked ordinary. The body underneath didn’t.
An earlier, smaller study looked at the same years from another angle. It followed 156 initially premenopausal women for four years, using CT scans to measure abdominal fat, and found that only the women who became postmenopausal had a significant increase in visceral fat, the fat that sits deep around your organs. Visceral fat is different from subcutaneous fat, the layer under your skin that you can pinch, and it’s much harder to spot by eye.
Two honest caveats. Both studies are observational, so they show what happened during these years, not that menopause is the only cause. And neither tested whether you can change the trend. What they do show is that the scale is a poor witness during this stretch. They also offer some reassurance: in SWAN, the fat and lean-mass trajectories flattened out after the transition, so the shift isn’t endless.

Signs Your Scale And Your Body Disagree
In the forums and comment threads where women compare notes, the same few patterns come up again and again. That’s an observation, not data, but it lines up with what SWAN would predict. Watch for these:
- The waistband tightens while the scale stays flat: fat may be shifting toward your middle even though your weight hasn’t changed.
- The scale drops but your lifts get harder: you may be losing lean tissue along with fat.
- The scale jumps overnight: water, food, and glycogen are the likely suspects, not fat.
- Your clothes fit better, but the number won’t budge: fat may be down while lean mass or water is up.
Muscle Loss vs Hidden Fat Gain: Which Risk Is Bigger?
Earlier versions of this article repeated a popular warning: rapid weight loss wrecks your muscle and your metabolism.
We rechecked it against the newest primary research, and it’s more nuanced. For a woman losing weight through diet, our position is that quietly gaining fat is the bigger midlife risk. That’s an editorial call, and we’ll flag where the evidence has limits.
A 2026 analysis in the American Journal of Clinical Nutrition pooled 374 adults from the DIETFITS diet trial, whose participants followed low-fat or low-carbohydrate diets (61% women, average age 39, average BMI 32).
Over six months, women lost 5.9 kg (13 lb). Lean tissue in the limbs, a stand-in for skeletal muscle, made up only 6.7% of that loss once the researchers adjusted for fat-free adipose tissue (the non-fat part of fat tissue, which scans can mistake for lean tissue), and the authors call the change “modest.”
Counted without that adjustment, all lean soft tissue was 26.7% of the loss, so measurement choices matter. In plain terms, most of the weight these women lost was not lean tissue. Because participants averaged 39, treat this as evidence about diet-based weight loss in general, not about women at midlife.
The second piece of evidence is about what protects lean tissue. In a 2026 retrospective cohort of 304 adults aged 20 to 74 (121 of them women) following a roughly 500-calorie daily deficit with 1.5 g/kg of protein, women who did resistance training lost the most fat and were the only group that gained fat-free mass:


| Exercise Group (Self-Selected) | Fat Mass Change (Women) | Fat-Free Mass Change (Women) |
|---|---|---|
| Resistance Training | −6.36 kg | +0.90 kg |
| No Exercise | −5.47 kg | −2.94 kg |
| Aerobic Exercise Only | −4.10 kg | −0.37 kg |
The authors conclude that resistance training improves the quality of weight loss by maximizing fat-mass reduction while preserving or increasing fat-free mass. One caveat: the study was retrospective, and participants chose their own group, so it shows an association, not proof that lifting caused the difference.
Now set the findings side by side. During diet-based weight loss, muscle loss was modest. During the menopause transition, the rate of fat gain doubled while the scale looked ordinary. The bigger surprise is fat accumulating while your weight looks unremarkable, which is why we’d rather you track your waist and your strength than fear a number.
How To Protect Lean Mass While You Lose Fat
Two levers have the best evidence for protecting lean mass: strength training at least twice a week and enough protein. Keep your caloric deficit moderate so you can actually sustain it, and the rest is consistency.
Resistance Training: The Lever That Added Lean Mass
The CDC recommends muscle-strengthening activity at least two days a week, working all your major muscle groups.
Its adult activity guidelines list legs, hips, back, abdomen, chest, shoulders, and arms, on top of 150 minutes of moderate-intensity aerobic activity a week. Aerobic exercise still earns its place, but in the cohort above it didn’t protect fat-free mass the way lifting did.
Start with our guides to strength training in perimenopause and balancing cardio and strength training. If you’re new to lifting or have heart concerns, read how to prevent heart attacks at the gym first, and if a “toned” look is the goal, see weight loss vs body toning.
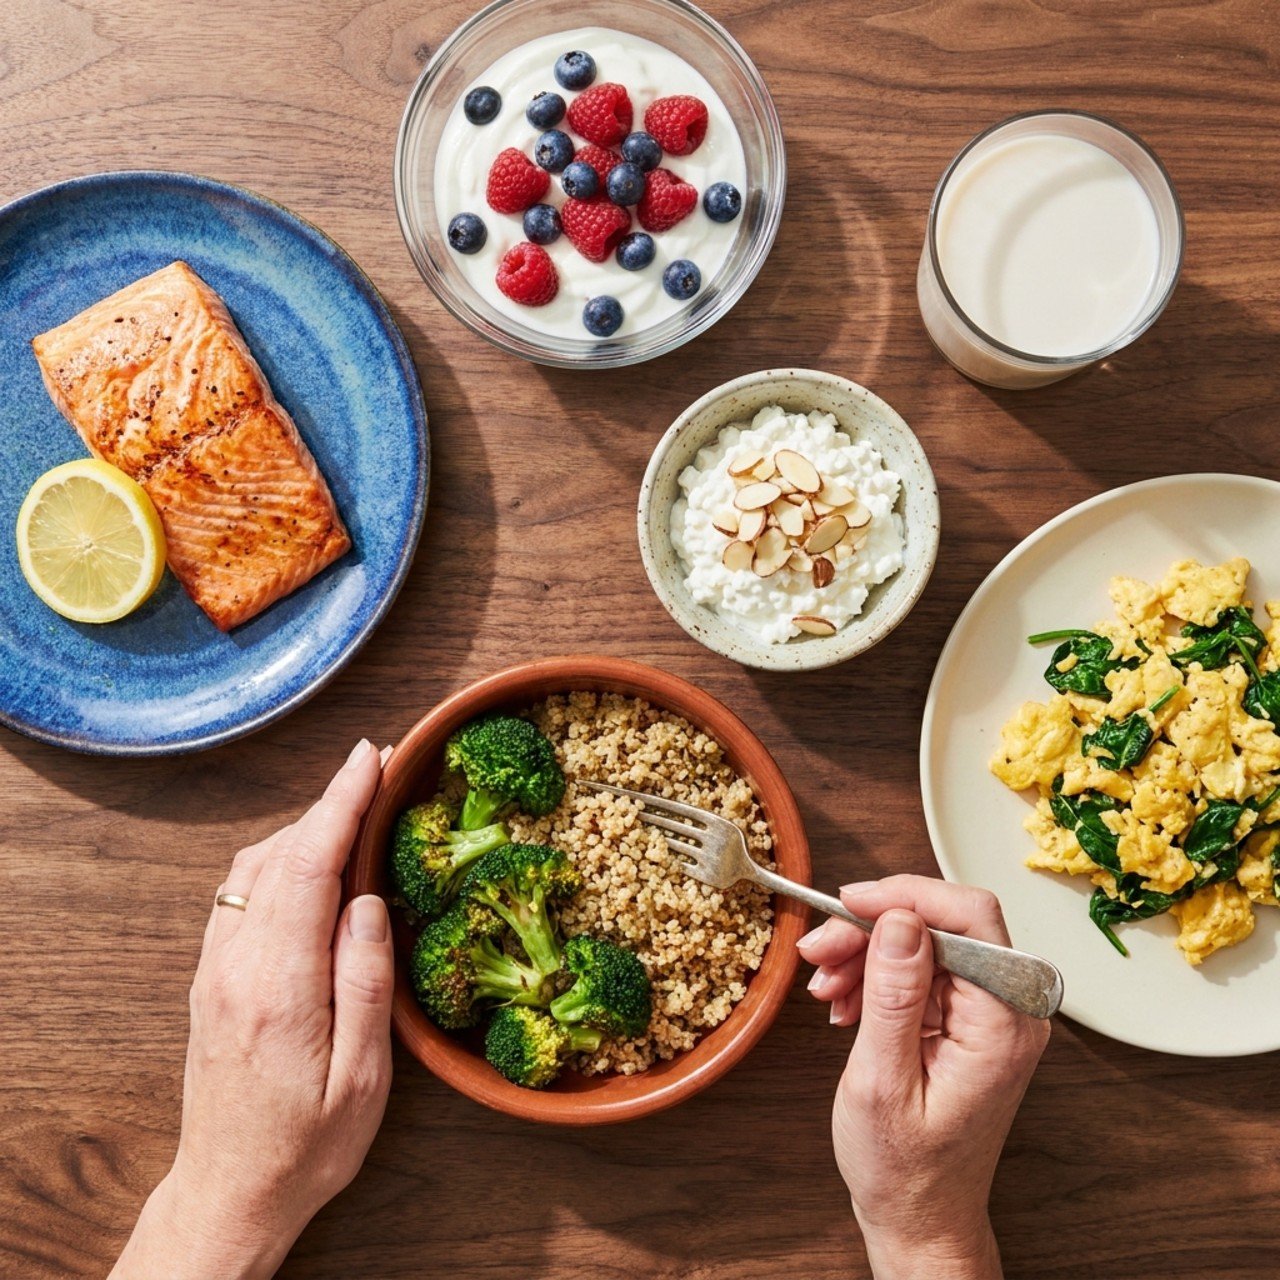
Protein: How Much Is Enough?
For exercising adults, the International Society of Sports Nutrition says a daily protein intake of 1.4 to 2.0 grams per kilogram of body weight is enough for most people to build or maintain muscle.
Its position stand adds that for people who pair resistance training with a lower-calorie diet, protein at two to three times the Recommended Dietary Allowance (RDA) can promote greater fat-mass loss and greater overall improvement in body composition.
In pounds, that’s roughly 0.6 to 0.9 grams per pound (our arithmetic), so a 150-pound woman lands at about 90 to 135 grams a day. If you have kidney disease or another condition that affects protein handling, check with your clinician first.
Here’s one example day, a template rather than a prescription:
- Breakfast: Scrambled eggs with spinach.
- Snack: Greek yogurt with berries.
- Lunch: Grilled chicken breast with quinoa and roasted vegetables.
- Snack: Protein shake with almond milk.
- Dinner: Salmon with brown rice and steamed broccoli.
- Snack: Cottage cheese with sliced almonds.
For full plans, see our high-protein diet plan and what to eat before and after a workout. Deficit depth, stress, and metabolism each have their own guide: start with shedding body fat, how a healthy metabolism actually works, and cortisol and belly fat.
The 3-Dial Check: Which Number To Trust When They Disagree
Trust the Tape and Strength dials before the Scale, because they’re harder to fool.
The 3-Dial Check reads Scale, Tape, and Strength together, because any one of them alone can mislead you. We built it for the situation this whole article is about: your weight says one thing and your body says another.
It isn’t a validated clinical tool, just a structured way to use the evidence above. Three dials also take the pressure off the scale, because one bad number can’t ruin your week when two others are still telling the truth.
Dial 1: The Scale (Read The Trend, Not The Day)
Use the scale as a trend line, not a verdict. Because water and glycogen drive day-to-day scale weight fluctuation, weigh under the same conditions and look at the weekly average rather than any single morning. Our full weight tracking method is in how to track your weight loss progress.
Dial 2: The Tape (Waist First)
Your waist is the tape measurement worth prioritizing, because it shows something the scale can’t: where you carry fat.
The National Heart, Lung, and Blood Institute (NHLBI) says a waist circumference of more than 35 inches for women increases your risk, and its method is simple: stand, place a tape measure around your middle just above your hip bones, and measure just after you breathe out.
That number flags risk. It isn’t a diagnosis or a goal to hit by Friday. What matters most is your own direction over time, and inch loss can show up when weight loss doesn’t.
Dial 3: Strength (The Dial Nobody Can Fake)
Strength tells you whether you’re keeping the tissue that matters, and it isn’t fooled by water weight.
Pick two or three movements you can repeat, such as a goblet squat, a push-up, or a dumbbell row, and log the weight and the reps. If your strength holds or climbs while the scale drops, that fits the pattern in the resistance-training cohort above. It’s a practical proxy, not a lab measurement.
How To Read The Three Dials Together
Read all three at once: when the Scale is the odd one out, go with Tape and Strength, and when Tape or Strength is the odd one out, double-check the measurement before you react.
Use the table below as a starting point, and give a new pattern two to three weeks before you change your plan.
| Scale | Tape | Strength | Possible Story | What To Do |
|---|---|---|---|---|
| Down | Down | Steady Or Up | Fat loss with lean tissue kept | Keep going and log the win. |
| Flat | Down | Up | Recomposition: fat down, lean up | Hold course. Don’t cut calories just because the scale stalled. |
| Down | Flat | Down | Possible lean-tissue loss | Raise protein, keep lifting, and ease the deficit. |
| Flat Or Up | Up | Flat Or Down | Possible fat gain | Review intake, sleep, and stress, then recheck in two to three weeks. |
| Up | Flat Or Down | Up | Water, glycogen, or new muscle | Wait two to three weeks before reacting. |
Treat the scale as one witness among three. If your dials point to recomposition, our guide to body recomposition for women over 40 explains what to do next. To start today, set your baseline in about five minutes:
- Scale: Weigh in and write the number down.
- Tape: Measure your waist just above your hip bones, after you breathe out.
- Strength: Log one lift with the weight and the reps.
Repeat every two weeks, and compare the trend, not any single day.
Which Measurement Tools Are Worth Using?
No single tool is perfect, so choose two you’ll repeat consistently and compare like with like. The table below covers what each one can and can’t tell you.
| Method | What It Measures | Watch Out For |
|---|---|---|
| DEXA Scan | An X-ray-based scan that estimates fat, lean tissue, and bone | The method behind the SWAN, DIETFITS, and resistance-training results above. It needs a clinic, so treat it as an occasional checkpoint, not a weekly habit. |
| Body Fat Scale (BIA) | Body composition estimated from a small electrical current | Readings shift with hydration and time of day. Agreement with DEXA was good in one study of 121 women aged 65 to 88 (those over 145 cm tall), but another study found BIA underestimated body fat percentage in young athletes. Neither sample matches a perimenopausal woman, so watch the trend. |
| Skinfold Calipers | Fat under the skin, pinched at set sites | Technique matters, so the same trained person should measure each time. |
| Tape Measure | Circumference of your waist, hips, and thighs | Free and repeatable. Measure at the same spot every time. |
| Body Mass Index (BMI) | Weight divided by height squared | The CDC notes it doesn’t directly measure body fat or distinguish fat, muscle, and bone. In one analysis, a BMI of 30 or higher identified only 49% of women with excess body fat. |
If you can pick only two for a home routine, we’d choose the tape measure and a strength log. They’re free and hard to game.
Want The Habits Behind Lasting Weight Loss? Get the free guide: 10 research-backed habits that help women lose body fat and keep it off, with no extreme diets. Send Me The Free Guide.
The Bottom Line
The weight loss vs fat loss question comes down to what you’re measuring: weight loss tells you how much you weigh, and fat loss tells you what actually changed.
After 40, the difference matters more: in SWAN, the rate of fat gain doubled during the menopause transition while the scale barely noticed. In the diet-trial data we cited (participants averaged 39), muscle loss was smaller than the popular warning suggests, and resistance training was the one exercise mode that added fat-free mass for women in the 2026 cohort.
So skip the crash plans and the daily weigh-in dread. Run the 3-Dial Check every couple of weeks, protect your muscle with lifting and protein, and let your waist and your strength tell you the truth about your progress. Your body isn’t broken, and you haven’t failed. You’ve just been reading one dial.
Glossary Of Key Terms
- Weight Loss: A reduction in total body mass, which may result from the loss of any combination of body water, muscle tissue, and fat.
- Fat Loss: The specific process of reducing excess body fat while aiming to keep lean muscle mass intact for better health outcomes.
- Body Composition: The relative proportions of fat, lean body mass (including muscle, bone, and organs), and water that make up an individual's total weight.
- Lean Body Mass (LBM): The total weight of the body excluding all fat mass; this includes muscles, bones, organs, and water.
- Basal Metabolic Rate (BMR): The minimum number of calories the body requires to sustain life-essential functions while at a state of complete rest.
- Caloric Deficit: A state in which an individual consumes fewer calories than the body burns, which is a requirement for the body to utilize stored fat for energy.
- Resistance Training: Physical exercises, such as weightlifting or bodyweight movements, designed to contract muscles against an external force to improve strength and mass.
- Progressive Overload: The practice of gradually increasing the intensity or demands placed on the musculoskeletal system to drive continuous improvements in muscle size and strength.
- Bioelectrical Impedance: A technology used by many home scales to estimate body fat by measuring how easily a low-level electrical current passes through different body tissues.
- Insulin Sensitivity: The efficiency with which the body’s cells respond to insulin; improving this through fat loss helps the body manage glucose more effectively and reduces diabetes risk.
FAQ
Can You Lose Weight Without Losing Fat?
Yes. Scale weight includes water, glycogen, and lean tissue, so it can fall without your fat changing. Track your waist and your strength alongside the scale to see what’s really changing.
How Do I Know If I’m Losing Fat Or Muscle?
Read three numbers together: your weekly average weight, your waist, and the weights or reps you can lift. A shrinking waist with steady or rising strength points to fat loss, while falling strength with a flat waist can signal lean-tissue loss. A DEXA scan is the most direct check.
Why Is My Waist Growing When The Scale Hasn’t Moved?
Weight and shape are different measurements. In the SWAN study, the rate of fat gain doubled and lean mass declined at the start of the menopausal transition, while weight didn’t accelerate, so a steady number can hide a change in body composition.
Can I Lose Fat And Build Muscle After 40?
Research suggests it’s possible. In a 2026 cohort of 304 adults aged 20 to 74, the women who did resistance training during weight loss lost the most fat and were the only group to gain fat-free mass. It wasn’t a study of perimenopausal women specifically, and participants chose their own exercise, so treat it as encouraging, not guaranteed.
Is BMI Accurate For Women?
Only as a rough screen. The CDC says BMI is moderately to strongly associated with other measures of body fat but doesn’t measure it directly, and in one analysis, a BMI of 30 or higher identified only 49% of women with excess body fat. Pair it with your waist measurement.
How Much Protein Do I Need To Keep Muscle While Losing Fat?
The International Society of Sports Nutrition says 1.4 to 2.0 grams per kilogram of body weight per day (roughly 0.6 to 0.9 grams per pound) is enough for most exercising adults to build or maintain muscle. Check with your clinician first if you have kidney disease.
Does Fat Loss Matter More Than Weight Loss For Health?
Fat and where it sits is what matters most. The WHO defines overweight as a condition of excessive fat deposits (though it screens with BMI), and the NHLBI says a waist of more than 35 inches for women increases risk. Neither is a diagnosis.
Just a quick note to say thanks for your recent contribution. Your writing style is both informative and enjoyable. Keep up the fantastic work!